For the complete documentation index, see llms.txt. Markdown variants of the ranked boards (dynasty and fantasy rankings for NFL, NBA, MLB and CFB) are available by appending .md to those URLs or by sending Accept: text/markdown; other pages answer 404.
DYNATYZE
Not startedThis page's interactive half has not started on this device. Nothing was read, and nothing was invented in its place. Reload the page.
Loading the baseball page
August MLB Player of the Month Awards: 4 Standout Stars
MLB Analysis
August MLB Player of the Month Awards: 4 Standout Stars
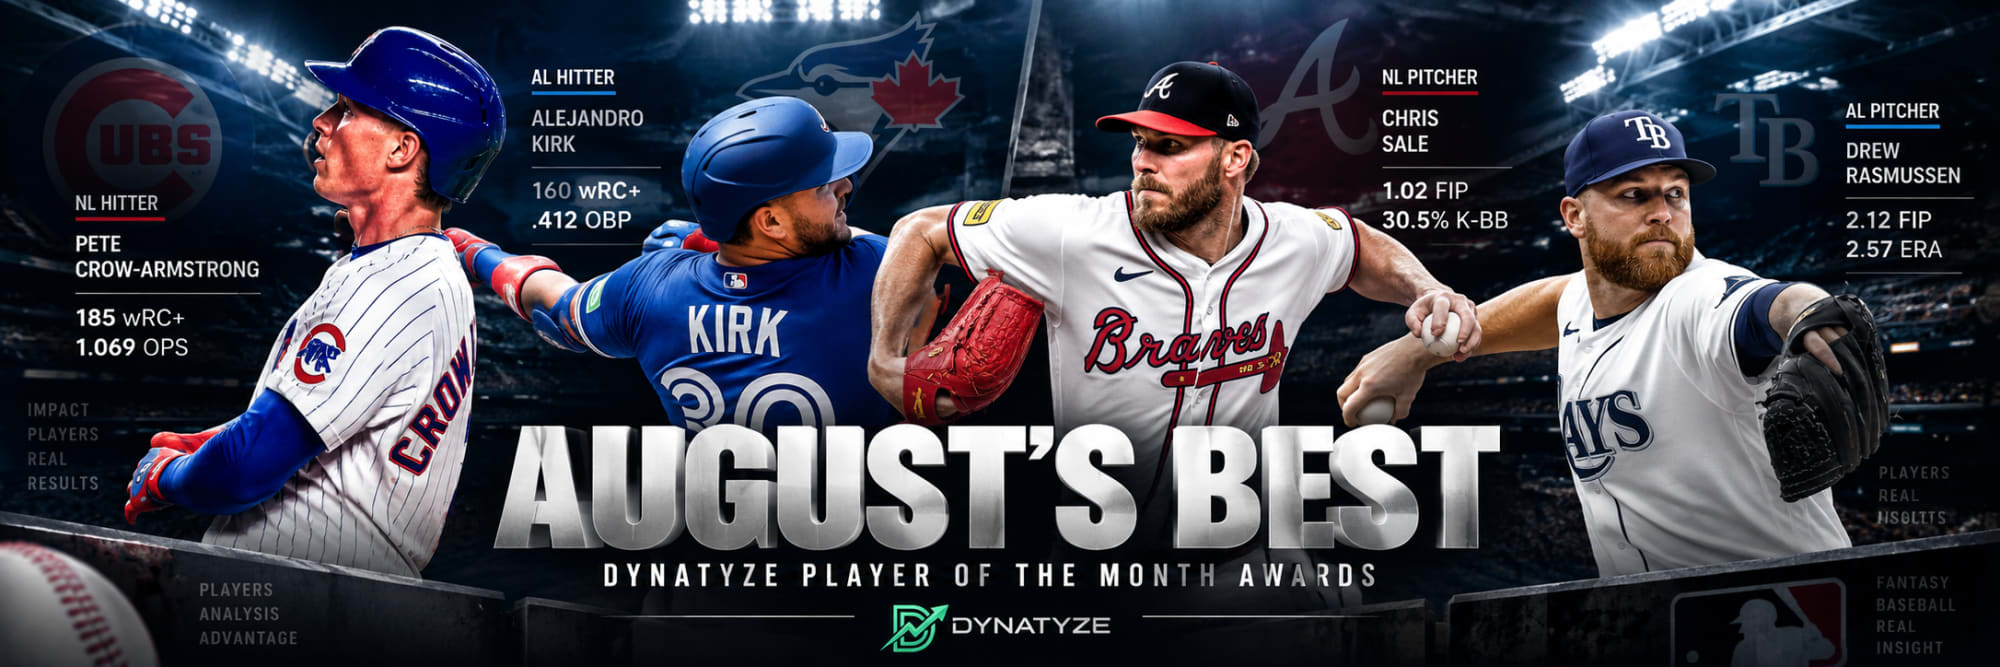
Pete Crow-Armstrong, Alejandro Kirk, Chris Sale and Drew Rasmussen headline our August MLB Player of the Month awards after dominant performances.
August can completely reshape the way we view a baseball season.
By this point in the year, we already have months of data telling us who players are supposed to be. Then somebody catches fire for four weeks and forces us to reconsider everything.
That's exactly what happened in August.
Some of baseball's biggest stars continued doing what we've come to expect. Others produced stretches that looked nothing like their season-long numbers. And when you dig beyond the traditional stats and into wRC+, wOBA, FIP, xFIP, WAR and Statcast data, four performances separated themselves.
For this month's Dynatyze awards, we're using performance exclusively from August 1 through August 31.
No April production. No reputation points. No full-season stat lines influencing the decision.
Just August.
Here are the four players who owned the month.
NL Hitter of the Month: Pete Crow-Armstrong, Chicago Cubs
There are hot months, and then there is what Pete Crow-Armstrong just did to National League pitching.
Crow-Armstrong entered August already established as one of baseball's most dynamic players. Over the next 28 games, he somehow found another level.
The traditional production immediately jumps off the page.
Crow-Armstrong hit nine home runs, drove in 29 runs, scored 14 times and stole six bases. He slugged .703 and finished August with a 1.069 OPS.
But those numbers only begin to describe how dominant he was.
Crow-Armstrong produced a .442 wOBA and 185 wRC+, meaning his overall offensive production was 85% better than league average after adjusting for league and park environment.
His power production was absurd.
A .424 ISO essentially means that Crow-Armstrong averaged more than four-tenths of an extra base per at-bat solely through extra-base hits. For context, a .200 ISO generally represents strong power. Crow-Armstrong more than doubled that mark in August.
And this wasn't simply a few fly balls sneaking over the fence.
According to the Statcast data, Crow-Armstrong generated 15 barrels across 86 batted-ball events, good for a 17.4% barrel rate. He also posted a 47.7% hard-hit rate with a 90.2 mph average exit velocity and 107.0 mph EV90.
The bat-tracking numbers add another layer.
Crow-Armstrong produced a 14.6% blast contact rate and 11.9% blast swing rate while recording an ideal attack angle on 56.0% of his swings.
That's a dangerous combination. He wasn't simply swinging hard. His bat path repeatedly put him in position to turn those swings into damage.
Perhaps the most encouraging number of all, however, is .264.
That was Crow-Armstrong's BABIP.
When a hitter produces a monster month, one of the first places to look for regression is an inflated batting average on balls in play. If Crow-Armstrong had run a .400 BABIP while posting these numbers, it would be fair to wonder how much of the production came from an unsustainable collection of ground balls finding holes and bloopers falling safely.
That wasn't the case.
He hit .280 despite a .264 BABIP because so much of his production came from actual damage.
The one obvious weakness was the strikeout rate. Crow-Armstrong struck out in 23.9% of his plate appearances while walking 11.9% of the time.
But when the contact produced a .424 ISO and .703 slugging percentage, you can live with some swing and miss.
He also accumulated 2.5 WAR in one month.
That number isn't entirely offensive, of course. Crow-Armstrong's defense and baserunning are major components of his overall value. But that's precisely what makes him such an unusual player.
He doesn't have to be an elite hitter to provide enormous value.
In August, he was an elite hitter anyway.
There wasn't a more deserving NL Hitter of the Month.
Dynatyze AUGUST NL HITTER OF THE MONTH: PETE CROW-ARMSTRONG
AL Hitter of the Month: Alejandro Kirk, Toronto Blue Jays
Pete Crow-Armstrong won the National League award by destroying baseballs.
Alejandro Kirk took a completely different route to the American League crown.
Kirk's August was a masterclass in controlling plate appearances.
Across 102 plate appearances, he hit .341 with a .412 on-base percentage and .534 slugging percentage. He homered five times, drove in 20 runs and finished with a .946 OPS.
The underlying offensive metrics were just as impressive.
Kirk's .399 wOBA ranked among the best marks in the American League, while his 160 wRC+ indicates he created offense at a rate 60% better than league average.
But the statistic that makes the entire profile work is his strikeout rate.
8.8%.
Kirk walked more often than he struck out.
He finished August with an 11.8% walk rate against that 8.8% strikeout rate, giving him the type of plate-discipline foundation that makes prolonged offensive slumps extremely difficult.
Crow-Armstrong struck out 32 times in August.
Kirk struck out nine times.
That's not necessarily an indictment of Crow-Armstrong. It's an illustration of just how different these two award-winning offensive months were.
Kirk consistently put himself in favorable situations and forced pitchers to beat him.
When he made contact, it wasn't empty contact either.
His Statcast profile shows an 89.6 mph average exit velocity, 101.6 mph EV90 and 110.2 mph maximum exit velocity. Kirk barreled six balls for an 8.9% barrel rate while producing a 40.7% hard-hit rate.
His bat-tracking numbers were even more interesting.
Kirk recorded a 15.6% blast contact rate and 13.5% blast swing rate, both actually exceeding Crow-Armstrong's marks. His 50.7% ideal attack-angle rate further supports the idea that this was quality contact rather than simply a batting-average heater.
There was some good fortune involved.
Kirk carried a .329 BABIP during the month, compared with Crow-Armstrong's .264.
But a .329 BABIP isn't remotely extreme enough to dismiss what Kirk accomplished, particularly when paired with his contact quality and exceptional plate discipline.
His .291 expected batting average and .415 expected slugging percentage were lower than the actual .341 and .534 marks, so it's reasonable to expect some regression from this exact level of production.
That isn't the same thing as saying the month was a fluke.
Kirk created an extraordinarily difficult offensive profile to attack.
He rarely chased himself into easy outs. He rarely struck out. He reached base more than 41% of the time. And when pitchers entered hittable areas, he produced enough impact contact to punish them.
The result was a .399 wOBA, 160 wRC+ and 1.5 WAR in one month.
That's our American League winner.
Dynatyze AUGUST AL HITTER OF THE MONTH: ALEJANDRO KIRK
NL Pitcher of the Month: Chris Sale, Atlanta Braves
August Stats: 27.0 IP | 2.00 ERA | 1.02 FIP | 2.19 xFIP 2.60 xERA | 11.33 K/9 | 0.67 BB/9 | 0.00 HR/9 34.3% K% | 1.9% BB% | 30.5% K-BB% | 1.5 WAR
Chris Sale's August becomes ridiculous the further you dig into it.
Start with the surface results.
Across 27 innings, Sale posted a 2.00 ERA.
Excellent.
Then look at his ERA estimators.
1.02 FIP.
2.19 xFIP.
2.60 xERA.
In other words, the underlying metrics don't expose some hidden weakness behind Sale's 2.00 ERA.
They reinforce it.
His 1.02 FIP was nearly a full run lower than his actual ERA.
And the reason becomes obvious when you look at what happened between the strikeout and the walk.
Sale struck out 34.3% of the hitters he faced.
He walked 1.9%.
That produced a 30.5% K-BB%.
For a starting pitcher, that's complete control over an at-bat.
Sale generated 11.33 strikeouts per nine innings while issuing just 0.67 walks per nine. He also didn't allow a single home run during the month.
Think about the paths an opposing hitter had available.
Sale wasn't giving away bases.
He was missing bats at an elite rate.
And even when hitters managed to put the ball in play, they weren't generating overwhelming damage.
His Statcast profile included an 89.1 mph average exit velocity and only a 4.5% barrel rate. Just three of the 67 tracked batted-ball events against him were barrels.
His hard-hit rate sat at 38.8%.
Even more impressive is the fact that Sale did this while carrying a .343 BABIP.
That's important.
A .343 BABIP means balls in play were actually falling for hits at a fairly high rate against him. Sale wasn't cruising through August because every ground ball happened to find a defender.
He simply removed so many opportunities for hitters to hurt him that it barely mattered.
His 77.8% strand rate wasn't particularly outrageous either.
There isn't some giant flashing regression indicator responsible for the ERA.
The dominance was largely earned.
The biggest question with Sale is always going to involve health and workload rather than talent. When he's physically right, we've spent more than a decade seeing what this arsenal can do.
August provided another reminder.
Among our four award winners, Crow-Armstrong may have had the most explosive offensive month.
But Sale may have produced the most dominant underlying performance of anybody.
A 30.5% K-BB% and 1.02 FIP across a month of starting pitching is outrageous.
Dynatyze AUGUST NL PITCHER OF THE MONTH: CHRIS SALE
AL Pitcher of the Month: Drew Rasmussen, Tampa Bay Rays
August Stats: 35.0 IP | 2.57 ERA | 2.12 FIP | 3.22 xFIP 3.15 xERA | 9.51 K/9 | 2.06 BB/9 | 0.26 HR/9 27.4% K% | 5.9% BB% | 21.5% K-BB% | 1.4 WAR
Drew Rasmussen didn't quite reach Sale's absurd level of dominance.
He did something else incredibly valuable.
He gave Tampa Bay 35 outstanding innings.
Rasmussen finished the month with a 2.57 ERA, 2.12 FIP, 3.22 xFIP and 3.15 xERA.
Once again, the gap between results and underlying performance is relatively small.
A 2.57 ERA might not be the exact level we'd project going forward, but there is very little evidence suggesting Rasmussen's month was built on smoke and mirrors.
He struck out 27.4% of opposing hitters while walking only 5.9%.
That gave him a 21.5% K-BB%.
Rasmussen averaged 9.51 strikeouts and just 2.06 walks per nine innings while surrendering only 0.26 HR/9.
The home-run suppression deserves particular attention.
Rasmussen faced enough hitters to complete 35 innings and allowed only one home run.
His contact data helps explain how.
Across 89 tracked batted-ball events, Rasmussen allowed an average exit velocity of 91.0 mph and 40.4% hard-hit rate. Those numbers aren't spectacular in isolation, but he surrendered just three barrels.
That's a 3.4% barrel rate.
Limiting barrels while maintaining a strikeout rate north of 27% is an extremely effective recipe for run prevention.
And unlike some pitchers who produce a sparkling ERA through an unsustainable strand rate, Rasmussen finished August with a 72.8% LOB%.
That's actually one of the more interesting numbers in his entire profile.
He wasn't stranding 90% of his baserunners.
His .261 BABIP certainly helped, but the overall statistical picture still supports a pitcher who performed extremely well.
His 2.12 FIP was better than his 2.57 ERA.
His 3.15 xERA and 3.22 xFIP were worse, but neither suggests Rasmussen suddenly becomes an average pitcher once the luck normalizes.
Instead, they provide a reasonable range.
The 2.57 ERA represents the results.
The low-3.00 estimators represent a more conservative expectation.
Either version is extremely valuable.
Rasmussen ultimately accumulated 1.4 WAR during August, narrowly trailing Sale's 1.5 despite pitching eight additional innings.
Sale was the more dominant strikeout pitcher.
Rasmussen provided more volume.
Both were exceptional.
And in the American League, nobody made a stronger case for our August pitching award.
Dynatyze AUGUST AL PITCHER OF THE MONTH: DREW RASMUSSEN
The Final August Ballot
Four awards.
Four very different paths to dominance.
Pete Crow-Armstrong overwhelmed National League pitching with power. He finished August with a .703 slugging percentage, .424 ISO, .442 wOBA and 185 wRC+, then added elite defense and baserunning value on his way to 2.5 WAR.
Alejandro Kirk controlled the strike zone. He hit .341, reached base at a .412 clip and walked more often than he struck out while producing a 160 wRC+.
Chris Sale simply overwhelmed hitters. A 34.3% strikeout rate against a 1.9% walk rate produced a staggering 30.5% K-BB%, while his 1.02 FIP was even better than his 2.00 ERA.
And Drew Rasmussen combined volume with efficiency, throwing 35 innings with a 2.57 ERA, 2.12 FIP and 21.5% K-BB%.
If we're choosing the single most dominant hitter, it's difficult to argue against Crow-Armstrong.
A 185 wRC+ and 2.5 WAR in one month from a player who also provides tremendous defensive and baserunning value is an extraordinary combination.
On the mound, Sale gets the same distinction.
There are plenty of ways to construct a good ERA over a relatively small sample.
Strand an unusual number of runners. Run a tiny BABIP. Get favorable sequencing. Benefit from strong defense.
Sale didn't need those excuses.
He struck everybody out, walked almost nobody, allowed zero home runs and finished with a 1.02 FIP despite opponents running a .343 BABIP against him.
That's dominance.
And that's ultimately what the Dynatyze Player of the Month awards are supposed to recognize.
August is in the books.
Pete Crow-Armstrong, Alejandro Kirk, Chris Sale and Drew Rasmussen owned it.