For the complete documentation index, see llms.txt. Markdown variants of the ranked boards (dynasty and fantasy rankings for NFL, NBA, MLB and CFB) are available by appending .md to those URLs or by sending Accept: text/markdown; other pages answer 404.
DYNATYZE
Not startedThis page's interactive half has not started on this device. Nothing was read, and nothing was invented in its place. Reload the page.
Loading the baseball page
I Told You to Sell These 5 Pitchers. Here’s What Happened
MLB Analysis
I Told You to Sell These 5 Pitchers. Here’s What Happened
Three weeks ago, I identified five pitchers whose strong ERAs weren’t supported by the underlying metrics. Now we’re checking the receipts, and regression hit.
Three weeks ago, I identified five pitchers whose second-half ERAs looked significantly better than the underlying numbers supporting them.
The idea was simple.
Fantasy managers often make the mistake of treating recent results as a new baseline. A pitcher strings together a few strong starts, the ERA drops, and suddenly he looks considerably more valuable than he did a month earlier.
But ERA only tells us what happened. Metrics like FIP, xFIP, xERA, strikeout rate, walk rate, BABIP, and strand rate can help us determine how sustainable those results actually are.
That was the entire premise behind our original sell-high list.
Using FanGraphs data from July 16 through August 11, Tomoyuki Sugano, Grant Holmes, Merrill Kelly, Sean Manaea, and Randy Dobnak all showed varying degrees of regression risk despite posting ERAs between 2.05 and 3.47.
Now we have three more weeks of baseball to evaluate those calls.
Using FanGraphs data from August 12 through September 2, every pitcher from the original article made four starts.
And every single one's ERA increased.
Here are the receipts.
1. Tomoyuki Sugano
Original Second-Half ERA: 3.47 Original FIP: 5.70 Original xERA: 7.17 Original BABIP: .225 Original LOB%: 96.4%
This is almost exactly what the original article warned could happen.
Sugano was our strongest sell because virtually everything holding together his 3.47 ERA looked fragile.
The two numbers that immediately stood out were his .225 BABIP and 96.4% strand rate.
Those weren't small advantages.
Sugano was allowing plenty of contact while striking out just 14.0% of hitters, yet balls in play were rarely becoming hits and almost nobody who reached base was coming around to score.
That combination was doing enormous work.
Then the pendulum swung violently in the opposite direction.
Sugano's BABIP jumped from .225 during our original evaluation period to .408 from August 12 through September 2. His strand rate collapsed from 96.4% to 48.8%.
The result?
A 10.00 ERA across four starts.
Some of that correction obviously went beyond normal regression. A .408 BABIP and 48.8% strand rate aren't numbers we'd expect Sugano to maintain going forward either.
But that's not really the point.
The original sell wasn't predicting that Sugano would suddenly become a 10.00 ERA pitcher. It was recognizing that a pitcher with a 3.47 ERA, 5.70 FIP, 7.17 xERA, and extremely fortunate BABIP and strand rate wasn't actually pitching like a 3.47 ERA arm.
Once those favorable outcomes disappeared, the surface results collapsed.
VERDICT: MASSIVE HIT
2. Grant Holmes
Original Second-Half ERA: 3.04 Original FIP: 4.21 Original xERA: 5.43 Original K%: 16.2% Original LOB%: 84.4%
Kelly was one of the more interesting calls in the original article because there wasn't one absurdly lucky statistic driving the sell recommendation.
His .282 BABIP wasn't extreme.
His 75.5% strand rate wasn't extreme.
The problem was the entire pitching profile underneath his 3.08 ERA.
Kelly already had a 5.07 FIP and 5.22 xERA, and his control was becoming a major concern.
Then it got worse.
Much worse.
Over his next four starts, Kelly walked 5.82 hitters per nine innings. His walk rate ballooned to 14.4%, while his strikeout rate fell to 15.5%.
That produced a microscopic 1.0% K-BB rate.
For perspective, Kelly was essentially walking a hitter for every hitter he struck out.
That's an incredibly difficult way for a starting pitcher to consistently prevent runs.
And unlike Sugano, Kelly can't blame an outrageous BABIP for what happened. His BABIP was actually just .262 during this stretch.
The problem was performance.
Kelly posted a 6.23 ERA, and every major estimator agreed that the ugly results were deserved. His xERA finished at 6.55, his FIP at 5.45, and his xFIP at 5.39.
The original article argued that Kelly's 3.08 ERA wasn't supported by the way he was actually pitching.
Three weeks later, there wasn't much ambiguity left.
VERDICT: MASSIVE HIT
4. Sean Manaea
Original Second-Half ERA: 3.03 Original FIP: 5.07 Original xERA: 5.07 Original K/9: 9.71 Original K%: 25.6% Original LOB%: 88.2%
Manaea was the pitcher we were most hesitant to sell aggressively.
There's an important reason for that.
His original underlying profile contained one legitimate weapon that the others largely lacked: strikeouts.
Manaea had generated 9.71 K/9 with a 25.6% strikeout rate. His 16.8% K-BB rate was easily the strongest among the five pitchers.
That's why his original sell level was only MODERATE.
But his 3.03 ERA still looked too good.
Manaea carried a 5.07 FIP and an identical 5.07 xERA, while an 88.2% strand rate was helping him repeatedly escape trouble.
Then nearly everything went wrong.
His strikeout rate cratered from 25.6% to 14.8%.
His K/9 dropped from 9.71 to 6.08.
His strand rate fell from 88.2% to 67.4%.
And most damaging of all, the home runs arrived.
Manaea surrendered 2.66 HR/9 during this stretch while allowing a massive 16.7% barrel rate.
His ERA exploded from 3.03 to 7.23.
This wasn't simply ERA noise, either.
Manaea's 7.55 xERA was actually worse than his ERA, while his FIP climbed to 6.60.
Even his 5.11 xFIP remained nowhere close to the 3.03 ERA that originally created the sell-high opportunity.
The reason we were more cautious with Manaea was legitimate. Strikeout ability can provide fantasy value even when other parts of a pitcher's profile become shaky.
Unfortunately, that strikeout advantage disappeared over the next four starts.
Once it did, the rest of the warning signs became impossible to hide.
VERDICT: MASSIVE HIT
5. Randy Dobnak
Original Second-Half ERA: 2.05 Original FIP: 4.74 Original xERA: 4.74 Original K%: 13.4% Original K-BB%: 4.5% Original LOB%: 86.3%
Did the 2.05 ERA we told fantasy managers to sell regress?
Absolutely.
Dobnak posted a 3.74 ERA over his next four starts, an increase of nearly two runs from the number that made him such an appealing sell-high candidate.
But there were also legitimate improvements.
His strikeout rate jumped from 13.4% to 22.3%, while his K/9 climbed from 5.13 to 8.72. His K-BB rate improved dramatically from 4.5% to 12.8%.
Those are meaningful changes.
His 3.58 xFIP was also the best mark among the five pitchers during this follow-up period.
At the same time, his 4.76 xERA remained considerably higher than his actual ERA, and his 4.20 FIP still suggested the overall run prevention wasn't quite as strong as the 3.74 ERA.
This is exactly why evaluating these calls requires more than checking whether someone's ERA went up or down.
The original argument was that Dobnak's 2.05 ERA wasn't sustainable because it was being produced alongside a 4.74 FIP, 4.74 xERA, 13.4% strikeout rate, and 4.5% K-BB rate.
The ERA regression arrived.
But Dobnak also improved some of the skills that made us skeptical in the first place.
So the sell call worked, but his new profile deserves more respect than the old one did.
VERDICT: HIT
The Bottom Line
Five pitchers.
Five sell recommendations.
Five ERA increases.
Here's what happened after the original article:
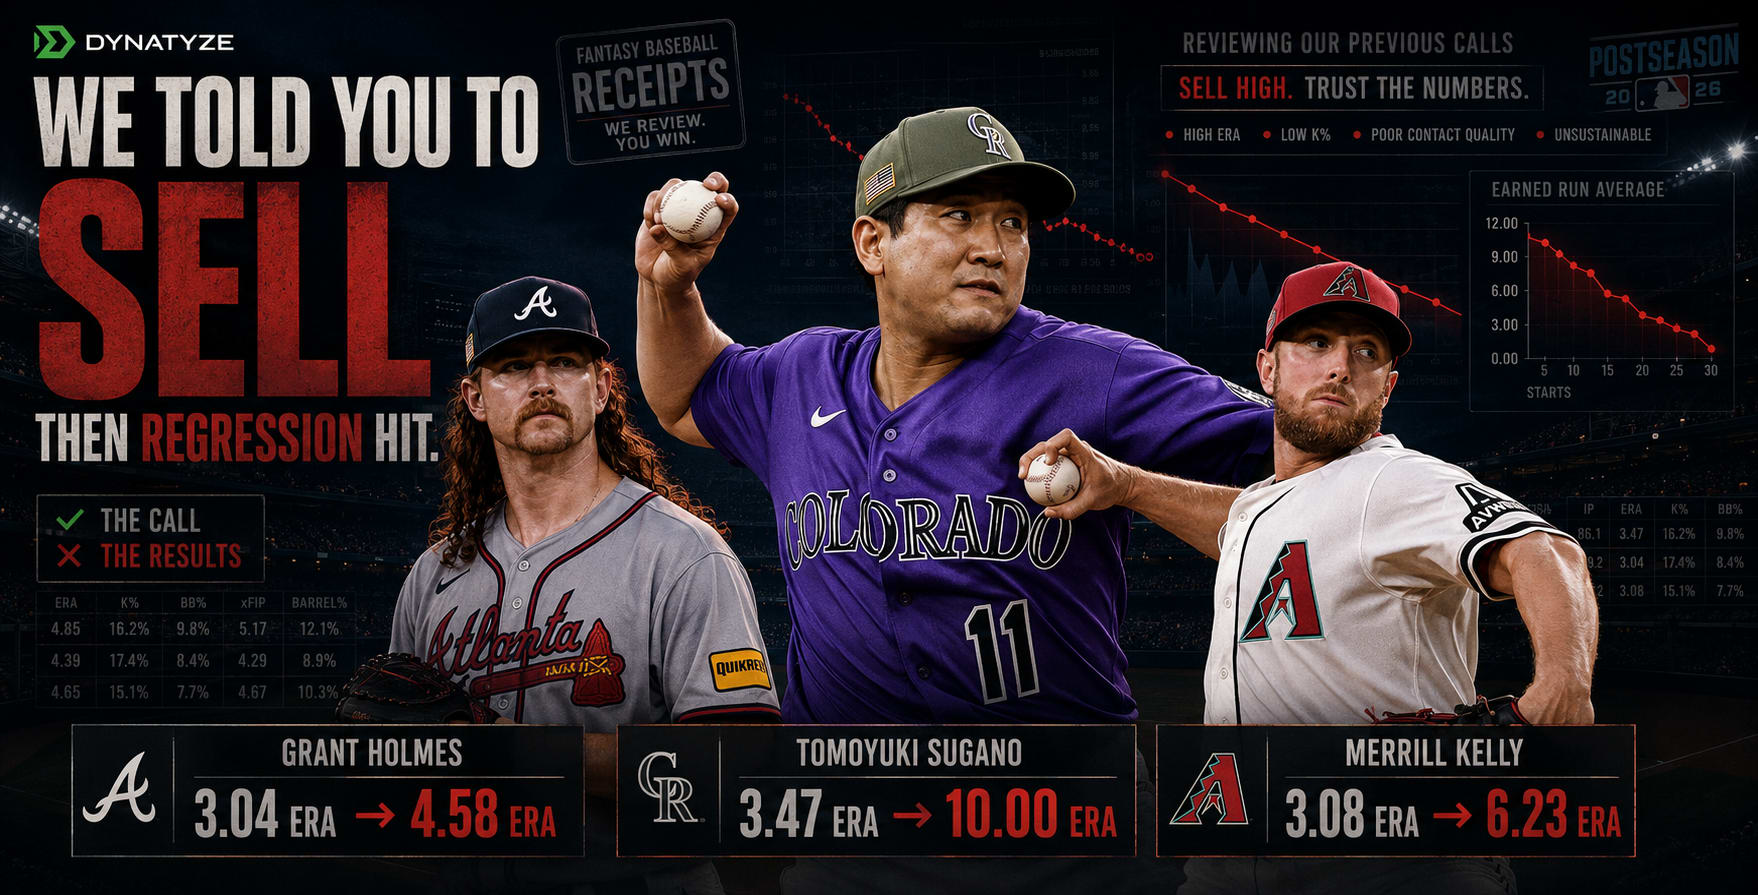
Tomoyuki Sugano: 3.47 ERA → 10.00 ERA
Grant Holmes: 3.04 ERA → 4.58 ERA
Merrill Kelly: 3.08 ERA → 6.23 ERA
Sean Manaea: 3.03 ERA → 7.23 ERA
Randy Dobnak: 2.05 ERA → 3.74 ERA
But the bigger takeaway isn't simply that all five calls worked.
It's why they worked.
Sugano's .225 BABIP and 96.4% strand rate were never a foundation fantasy managers should have trusted. Kelly's ERA estimators and deteriorating control were telling a dramatically different story than his 3.08 ERA. Manaea had legitimate strikeout ability, but his run prevention still contained warning signs. Holmes lacked the dominance necessary to comfortably support his results. Dobnak's 2.05 ERA was sitting miles away from both his FIP and xERA.
That's the value of looking underneath the surface.
Expected statistics aren't crystal balls. They won't tell us exactly when regression will arrive, and they certainly don't guarantee that every overperforming pitcher will immediately collapse.
But they can show us when the performance we're seeing on the surface doesn't match the process underneath it.
Three weeks ago, these five pitchers were giving fantasy managers an opportunity.
Their ERAs looked good enough to sell.
The underlying numbers gave us a reason to do it.
And this time, the regression didn't make us wait very long. Looking for MORE fantasy baseball insight? Check out our ARTICLES page
Think Like a GM
Start managing your team on Dynatyze, where our data & tools lead to championships. Sign up for an account today and dominate your league.